Labor Summary Report |
  
|
Labor Summary Report |
|
Labor Manager > Reports - Labor Analysis > Labor Variance Report
Creating a Labor Summary Report
Sales (Forecast Metric) Summary
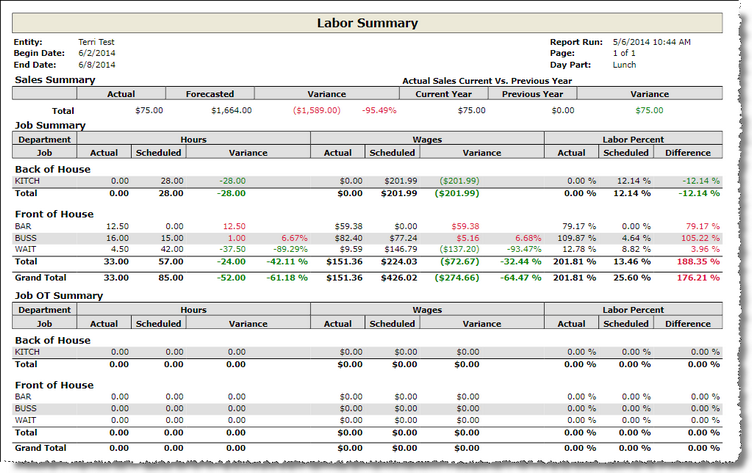
After identifying a date range, the Labor Summary Report provides a summary of:
oactual sales (or alternate forecast metric value), forecasted sales and the variance between them,
ocurrent year sales, previous year sales and the variance,
oactual hours worked, scheduled hours and the variance,
oactual wages, scheduled wages and the variance,
oregular hours as a percentage of sales and scheduled hours as a percentage of sales,
oovertime hours worked, scheduled overtime and the variance,
oovertime wages paid, scheduled overtime wages and the variance,
oovertime hours as a percentage of sales and scheduled overtime hours as a percentage of sales.
All of the labor data is sorted by department and job. Additionally, the report may be filtered by day part.
Favorable variances are noted in green and unfavorable variances are noted in red.
1.Enter the first date to include in the summary in the Begin Date field.
2.Enter the last date to include in the summary in the End Date field.
3. To filter by day part, select a single day part from the drop-down. Data will be limited to the configured hours of the day part. To run the report for all day parts, leave the field blank.
4.To include unposted schedules in the data, check the Include Unposted Schedules checkbox.
5.To open the report in a new window, check the Open in a new window checkbox.
6.Click the Run Report button.
Sales (Forecast Metric) Summary
This section provides a comparison of values based on the specified forecast metric in labor definitions. Actual is compared to forecasted value for the current period and the resulting variance is shown as a value and percentage. The current year metric is also compared against previous year if data is available.
Example: If actual sales for a given day is $1,050 and the forecasted sales where $1,200, then the variance would be ($150) or -12.5%. (150/1,200 = 12.5%)
This section provides a comparison of hours, wages, and labor as a percent of sales. If a day part filter has been selected, the data shown will only include hours and wages that fall within the configured day part.
For example:
Hours: If actual server hours is 40 and the scheduled server hours is 42 hours, then the hour variance would be -2 or -4.76%. (-2/42 = -4.76%)
Wages: If actual server wages is $250.00 and the scheduled server wages is $240.00, then the wage variance would be $10 or 4.17%. (10/240 = 4.17%)
Labor Percent: Based on the examples provided above, actual wages are $250 and actual sales are $1050, so the actual labor percent of sales is 23.81%. (250/1050 = 23.81%) The scheduled wages are $240 and forecasted sales are $1200, resulting in a scheduled labor percent of sales of 20%. (240/1200 = 20%). The difference is calculated by subtracting the scheduled percent from the actual percent. (23.81% - 20% = 3.81%)
The Job OT Summary follows the above calculations for hours determined to be overtime.
For information on the report icons and how to print or export the report, please visit the Report Icons section under Tools.
If after running the report, you want to view a report from a different week, click on the downward pointing arrow in the upper left of your screen and choose a different begin date and end date.
Send feedback on this topic.