Schedule Variance Report |
  
|
Schedule Variance Report |
|
Labor Manager > Reports - Labor Analysis > Schedule Variance Report
Creating a Schedule Variance Report
Schedule Variance Detail Actuals
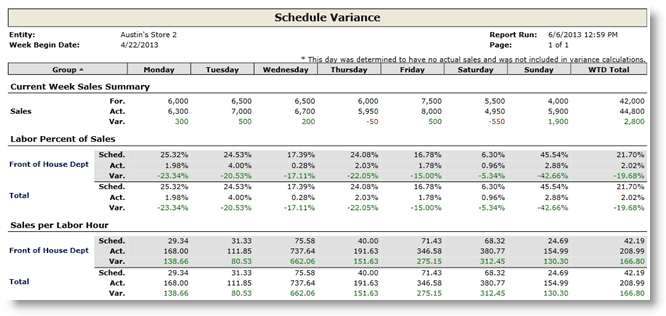
The Schedule Variance Report shows forecasted sales, actual sales and the variance between the two figures.
The Schedule Variance Report also shows time that was scheduled (Sched.), time that was worked (Act.) and a calculation of the variance (Var.) between the two figures. This information is examined both as labor as a percent of sales and sales per labor hour. This data is broken out by department.
Favorable variances are noted in green and unfavorable variances are noted in red.
1.Choose the Week Begin Date from the drop-down.
2.To filter by day part, select a single day part from the drop-down. Data will be limited to the configured hours of the day part. To run the report for all day parts, leave the field blank.
3.To include unposted schedules in the data, check the Include Unposted Schedules checkbox.
3.To open the report in a new window, check the Open in a new window checkbox.
4.Click the Run Report button.
If after running the report, you want to view a report from a different week, click on the downward pointing arrow in the upper left of your screen and choose a different week begin date.
Labor as a percent of sales is a calculation that shows the cost of labor divided by sales. This will tell you what percentage of daily sales is spent on labor.
This section of the report includes three figures:
1.Sched. - This is the forecasted cost of labor divided by forecasted sales.
Calculation example: If forecasted sales for a given day is $10,000 and the scheduled cost of labor in the 'Front of House' department is $350, then the labor as a percent of sales figure for the 'Front of House' department would be 3.5%. (350/10,000=3.5%)
2.Act. - This is actual cost of labor divided by actual sales.
Calculation example: If sales for a given day is $10,500 and the total cost of labor in the 'Front of House' department is $258, then the labor as a percent of sales figure for the 'Front of House' department would be 2.5%. (258/10,500=2.5%)
3.Var. - This is the variance between the scheduled and actual percentages. This figure assists in assessing how close forecasted predictions were to actual data. Negative numbers (shown in green) indicate that the actual percentage was lower than the scheduled percentage anticipated. Positive numbers (shown in red) indicate that the percentage for actual data was greater than the scheduled percentage anticipated.
Calculation example: Actual percentage (2.5%) minus the Forecasted percentage (3.5%) = -1.0%
This indicates that the actual percentage was less than the forecasted percentage. The closer this number gets to 0 indicates how close planned and expected labor costs compare to the actual labor costs.
Sales per labor hour is a calculation of sales divided by total hours worked. This will provide an average of sales per labor hour spent.
This section of the report includes three figures:
1.Sched. - This is the forecasted sales divided by the number of hours scheduled.
Calculation example: If forecasted sales for a given day is $10,000 and the scheduled number of hours in the 'Front of House' department is 50, then the sales per labor hour figure for the 'Front of House' department would be $200. (10,000/50=$200)
2.Act. - This is the actual sales divided by the actual number of hours worked.
Calculation example: If sales for a given day is $10,500 and the actual number of hours worked in the 'Front of House' department is 57, then the sales per labor hour figure for the 'Front of House' department would be $184.21. (10,500/57=$184.21)
3.Var. - This is the variance between the scheduled and actual figures.
Calculation example: Actual sales per labor hour ($184.21) minus the scheduled sales per labor hour ($200.00) = $15.71
This indicates that the actual figures were less than the forecasted figures. The closer this number gets to 0 indicates how close planned and expected sales per labor hour was to the actual sales per labor hour. This number is displayed in red because the forecasted data fell short of the actual data.
For information on the report icons and how to print or export the report, please visit the Report Icons section under Tools.
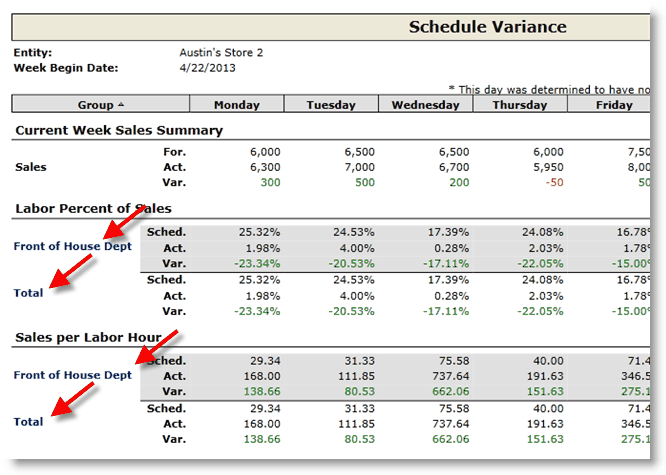
The Schedule Variance Report has available links that will expand the data and break it down by job. By clicking on the link of either a department or the Total line, you will be taken to the Schedule Variance Detail Report.
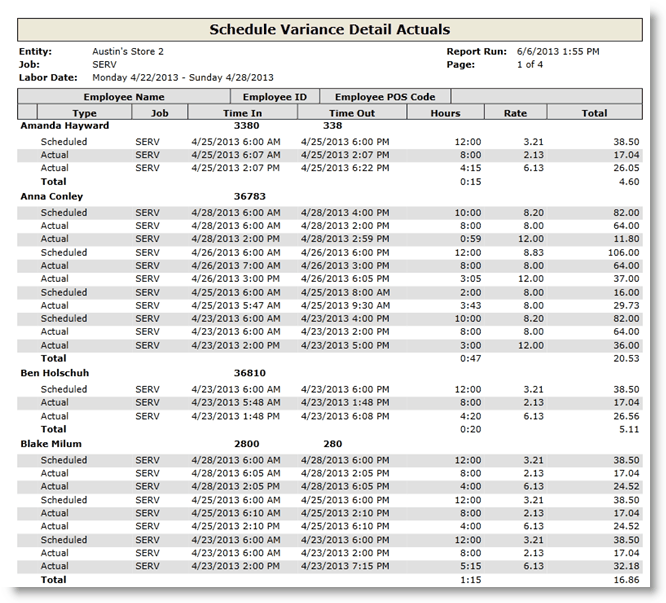
Drilling Down to Schedule Variance Detail Actuals
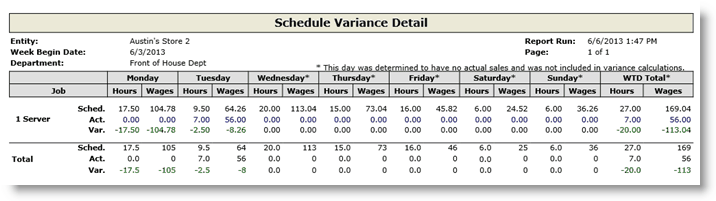
From the Schedule Variance Detail Report, you can further drill into either a specific day or the entire week to see all individual punch and schedule data. To drill down to a specific day's data, click on either the link for Actual Hours or Wages for that day. Note that both links for the day (either Hours or Wages) will take you to the same data. To drill down to see the entire week's data, click on either the link for Actual WTD Total Hours or Actual WTD Total Wages.
1.No data on the Schedule Variance Report, but data is populated when you drill down to the Schedule Variance Detail Report?
oEvery figure on the Schedule Variance Report uses the daily forecasted sales data or the actual daily sales data in its calculation. Keep in mind that the forecasted data can be set up to be derived from past sales data. If that is the case for your entity, your forecasted data will not be accurate if any past sales data is missing. Therefore, if you see no data on the report, there may be an issue with your data not polling in properly. Contact Compeat Technical Support so they can assist.
oIs the Rate different than what you expected to see?
oDid the employee work a job with a wage less than the minimum wage for the entity? Did they make enough in tips to meet minimum wage? If not, their wage may have been adjusted. For more information, please see the Minimum Wage and Tips information in the Concepts section. Did the employee have overtime and work multiple jobs with different wages that are in the same wage group that is set to include weighted average overtime? If so, please see the Weighted Average Overtime information in the Concepts section.
Send feedback on this topic.