The Inventory Count Variance report generates a list of theoretical quantities compared to actual inventory counts for a specified period.
The theoretical ending inventory count is calculated by taking the actual ending inventory count from the preceding period as the beginning inventory, then adding all the purchases (from AP invoices and manual checks, or from portion cut sheets; or for prep items from the prep item creation posting), and subtracting all of the usages, the sales of the items (from the recipes in the menu items, the POS sales data, the ingredients in a prep items, and the whole cuts when portioning) and any inter-store transfers of inventory or wasted/donated inventory (inventory adjustments, which are not broken out in this report).
The actual inventory count used is the count you select by its posting date, after first entering a date range and getting prompted by Compeat to select a posting date.
The theoretical usage in dollars is calculated by taking a weighted average of the actual dollars per unit (i.e., the sum of dollars divided by the sum of units) during the specified time period, and then multiplying the weighted average dollars per unit times the number of theoretical usage units. If the start date of the time period (e.g., 1/1) is immediately following an inventory count date (e.g., 12/31), the inventory quantity and unit cost of that date will be included in the calculation.
Note: An asterisk is displayed on the report in the Beginning Inventory column for uncounted items— that is, items for which no count was entered so the theoretical count was used instead. Variance is, by definition, zero for uncounted items.
It is expected that there will be some variance between the theoretical and the actual inventory. This report provides a numeric and percentage variance so you can determine which are normal variances and which indicate a problem of some sort.
Note: A negative variance indicates you have a lower actual count than theoretical count; a positive variance indicates you have a higher actual count than theoretical count; three asterisks (***) in the Variance % column indicate there was a division by zero, which is undefined.
The report has drill-down capabilities for the Item Description, Receiving, Xfer In, Prod/Portioning, Xfers Out, Waste, Theo Usage, and Theo End Inv fields. Most drill-down fields will open the Inventory Transaction History Report, which shows details of the history of the selected item.
This report also has an ‘Export to Excel’ option that sends all the data in the report to excel with the data for each item flattened to one row, which makes it easy to sort and sub-total rows without the need to cut and paste information.
![]() Click to view/hide picture.
Click to view/hide picture.
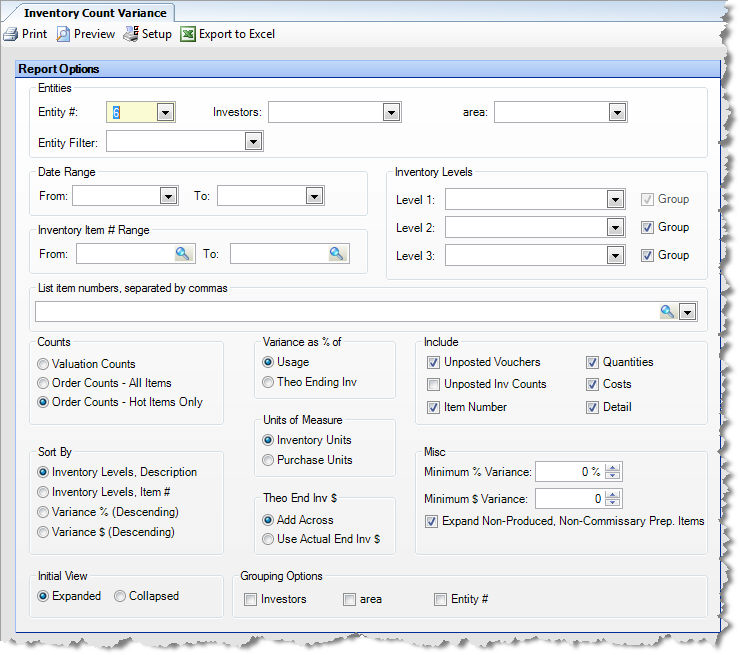
The following options are available to customize your report:
Entities To limit the report to a specific entity, select the entity from the drop-down list. Alternatively, you can limit by store groups (defined under Setup > Enterprise Definitions), or by entity filter (defined under Setup > Entity > Entity Filters). Leave blank to include all locations.
Date Range Enter beginning and ending dates of the period you wish to report on. The report should be run for an inventory period, with the beginning-date being the day after an inventory posting and the ending-date being the day of a new inventory valuation, so that actual count numbers can be compared to theoretical quantities.
From
Enter the beginning date of the period you wish to report on. The
report will run using the valuation count that was posted on the last
day of the prior period (prior to the one you are reporting on) as
your beginning inventory.
For an accurate comparison between actual and theoretical quantities,
it is important to use the day after an inventory posting. If you
do not, the system will report theoretical beginning quantities where
the actual beginning inventory quantities should be.
To
Enter the ending date of the period you wish to report on. If you
have entered a valuation count on the period end-date but not posted
it yet, you can check "Include Unposted Inv. Counts" to
use these counts in the report.
If you do not use the date-of an inventory count, system will leave
0 quantities in the actual ending inventory count field.
Note: Because the purpose of this report is to compare
actual counts to theoretical quantities, it is important to run the report
on days when the actual numbers are most accurate, that being the day
after a count to the day-of a count. Although the report will accept dates
that fall in between counts, the variances returned will be less reliable.
This report has an alternative use as a way to view theoretical quantities.
If you enter the beginning date as the day after a count, and the ending
date as, say the current date, the system will show theoretical quantities
for the current date and allow you to spot-check inventory between counts.
Inventory Item # Range To limit the report to a specific subset of items, specify an item number range.
Inventory Levels To limit the report to a particular inventory level, select the inventory level from the drop-down list; otherwise, leave blank for all inventory levels. Check "Group" next to a level to group by that level and display the level description as a subheading in the report.
List Item Numbers To include only specific items in your report, enter the item numbers or click on the finder (magnifying glass icon) and select the items you wish to include; separate multiple items with commas.
Counts
Valuation Counts Specify counts of all items for which the Inventoried checkbox is selected (on the Restaurant Inventory Items screen).
Order Counts All Items Specify counts of all items for which the Order Counts checkbox is selected (on the Restaurant Inventory Items screen).
Order Counts Hot Items Only Specify counts of all items for which the Hot Item checkbox is selected (on the Restaurant Inventory Items screen).
Sort By Choose the sorting criteria you wish to apply to the report.
Initial View Select whether to show the report in collapsed form (summary) or expanded form (detail). This can be changed in the report preview screen.
Variance as % of
Usage This method calculates variance percentage as a function of theoretical usage.
Theo End Inv This method calculates variance percentage as a function of theoretical ending inventory.
Unit of Measure Select whether to base the report on inventory or purchase units. If "Purchase Units" is selected, prep items will display using their production unit, except prep items that are supplied by the commissary in a given entity, which will still display their default purchase unit.
Theo End Inv $
If you are using the ‘Last Invoice Valuation’ Method, the variance and theoretical ending inventory dollar amounts on your report will likely be different depending on the selection made here. Visit the Compeat Support Website for additional information on this topic and more. Customers using a ‘Weighted Average’ valuation method will not see a difference with this setting adjusted.
Add Across Calculates theoretical ending inventory dollars by adding everything to the left of the Theo End Inv column. Column headings indicate the sign used for the added quantity; for example, quantities in Purchases are added while quantities in Waste are subtracted from the total.
Use Actual
End Inv $ Calculates the theoretical ending inventory dollars
by first calculating the actual dollars per unit and then using that
as a factor to calculate the theoretical dollars. It is calculated
as:
(Actual Ending Inventory dollars/Actual Ending Inventory quantity)
x Theoretical Ending Inventory quantity
Grouping Options Specify whether to group the report by entity and/or store groups.
Include
Unposted Vouchers Specify whether to include items from unposted invoices and manual checks on the report. This feature allows you to get accurate inventory variances regardless of the posting status of invoices. This allows accounting entities, who may not allow restaurants the ability to post, to get reports even before the home office has received the appropriate paperwork necessary to post the work entered by the restaurants. By default, this option is selected.
Unposted Inv Counts If you choose to use this option by checking it, your ending inventory values will reflect what is currently entered on the corresponding Inventory Counts screen (Valuation Counts or Order Counts).
Item Number Check to show Item Number in the report.
Quantities Check to include a second line for each item that displays quantities (instead of dollar amounts).
Costs If this box is checked, a second line will display under each inventory item that will show the dollar amounts for each quantity listed. If you use standard costs they take precedence here.
Note: In order to view costs on this report, your group must have "Show Costs on Inventory Count Variance Report" checked under Inventory > Inventory Counts of the Security > Groups > Screen Access tab.
Note: When you select the Expand non-produced option, there is a chance that the ending inventory value will not match the beginning value on the next reporting period. To see the exact ending/beginning values that will be written to your General Ledger, turn this expansion option off. This is a result prep items being turned back into inventory products for the sake of report display and does not affect your cost of goods calculations or your P&L.
Misc
Minimum Variance % Specify a percentage amount to filter out items with less variance than this percentage.
Minimum Variance $ Specify a dollar amount to filter out items with less variance than this amount of money.
Use Standard Costs Select whether or not to use standard costs. If checked, standard cost will be used in each column with a dollar value. (Only available when "Use standard costs" is selected in the Other tab of Other Definitions.)
Expand Non-Produced, Non-Commissary Prep Items If checked, the quantities of these items will be broken down into the quantities of the ingredients they contain, based on their recipes. The actual counts of the ingredients shown in the report will be increased by these quantites. This ensures that ingredients that were not counted, because they were used in prep items that were counted, show proper variances on the report.
The Inventory Count Variance report appears similar to the following:
Note: All items created through portioning and prep productions are reported in the column (+/- Prod/Portioning). Items depleted through portioning and prep production display as part of the Theo Usage column, alongside depletion from sales mix, commissary shipments, and outside order shipments.
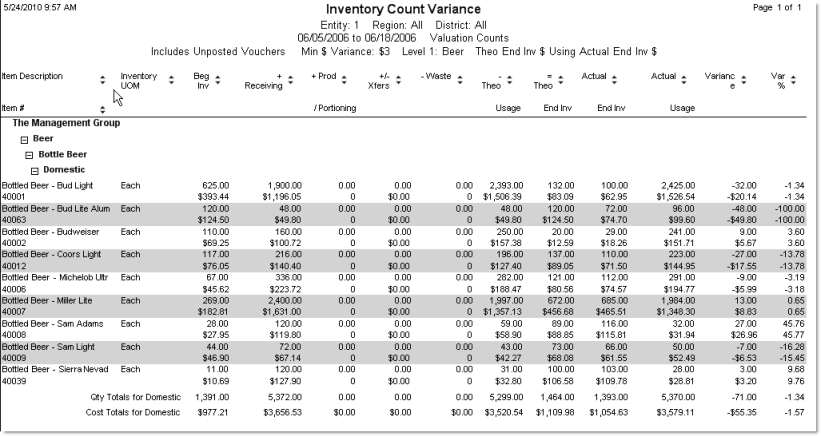
Each item is identified by its Description and/or Item # at the beginning of the row. Most fields can be displayed alternatively in dollars or quantity, depending on the report options selection. The following descriptions assume a quantity selection, but the description is much the same if Costs were selected.
Note: the math used to calculate the Theoretical Ending Inventory is shown in the column headers.
UOM Displays the Description of the Standard Units of Measure for the item as either inventory or purchase units, depending on the Units of Measure selected on the report options.
Beg Inv Displays the beginning inventory on the day before the From date selected for the report, based on the post type selected (valuation or inventory counts).
Receiving Shows the quantity received (through AP Invoices or Manual Checks) during the date range specified.
Xfers Shows the sum quantity of inter-store transfers in and out during the specified time period. That is, if you transferred 10 units of an item out and received 10 units of the same item during the time period, this field would show "0."
Prod/Portioning Shows the quantity produced during the specified time period.
Waste Shows the amounted wasted during the specified time period.
Theo Usage Shows the theoretical quantity used during the date range. This is based on sales (including commissary shipments and outside order shipments) and usage resulting from portioning and prep production. The per unit cost used to calculate this number is based on a weighted average of the date range of the report.
Theo End
Inv Shows the theoretical ending inventory— the quantity expected based on
all of the inventory-affecting transactions made in Compeat.
When Add Across is selected
in report options: Calculated as Beg Inv + Receiving + Xfers In +
Prod/Portioning - Xfers Out - Theo Usage.
When Use Actual Ending Inv $
is select in report options: Calculated as (Actual Ending Inventory
dollars/Actual Ending Inventory quantity) x Theoretical Ending Inventory
quantity. If no actual ending inventory exists for the item, the cost
used will be a newly calculated last invoice cost for that item based
on the date range of the report.
Actual End Inv Shows the counted quantity. This is the last posted quantity from either valuation or order counts, depending on the report options selected.
Actual Usage Shows the quantity used during the selected time period. Calculated as beginning inventory + purchasing + transfers-in + production – ending inventory.
Variance Shows the difference between the theoretical quantity and the actual quantity. Calculated as Ending Inv - Theo Ending Inv.
Var % The variance as a percent of either Theo Usage or Theo Ending Inv, depending on report options selected. Calculated as Variance/Theo Usage or Theo Ending Inv x 100%. If there is no variance, i.e., the Variance column is 0, then "***" is displayed.
Note: Both the Inventory Theoretical Cost report and the
Inventory Count Variance report have columns representing theoretical
usage. In the Inventory Theoretical Cost report this is the Qty
Used, Theo column; in the Inventory Count Variance report, it is
the Theo Usage column. The calculations
for each of these are slightly different between the two reports, so in
some cases the numbers may not match.
In the Inventory Theoretical Cost report, the Qty
Used, Theo amount is calculated as sales + waste quantities.
In the Inventory Count Variance report, the Theo
Usage amount is simply the sales amount. Thus, Theo
Usage = Qty Used, Theo - Waste.