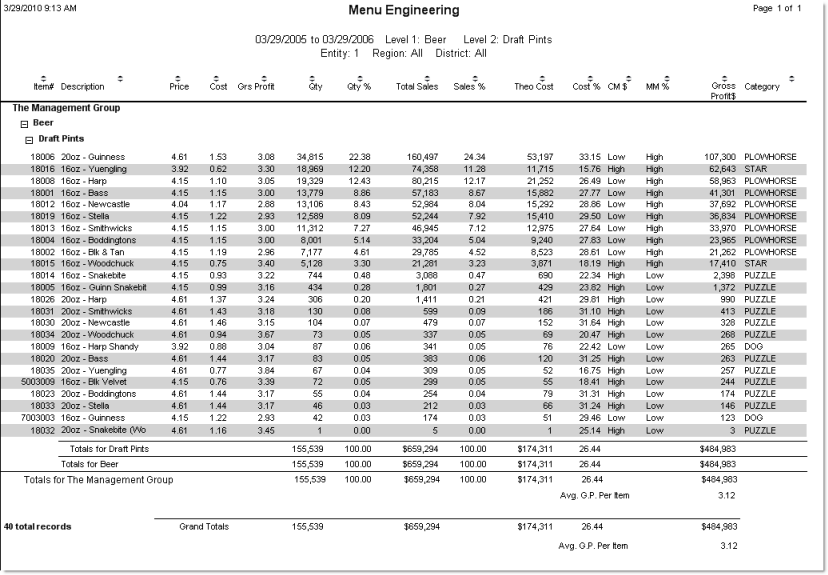
This report allows you to compare the performance of menu items against each other using the contribution margin (gross profit) and menu mix (popularity of the item).
To obtain meaningful information from this report, it should always be run for a specific group of items, so that like items are compared. For example, the gross profits on wine may be significantly different from the gross profits on burgers; thus, a comparison between the two would not be a good basis for menu engineering. Comparing all wines, on the other hand, would allow you to determine the relative performance of different bottles. You can limit the items included in the report either by menu item number range or by menu item level.
![]() For more on how to analyze some of the
report's information, see the reference material on Menu
Engineering.
For more on how to analyze some of the
report's information, see the reference material on Menu
Engineering.
Note: In order to generate this report, you must use the Compeat POS Polling feature.
The report includes drill-down capabilities that allow you to access related data for an item by clicking on it from the Preview screen. Drill-down capabilities are available for the Item # and Description fields.
The options screen appears similar to the following:
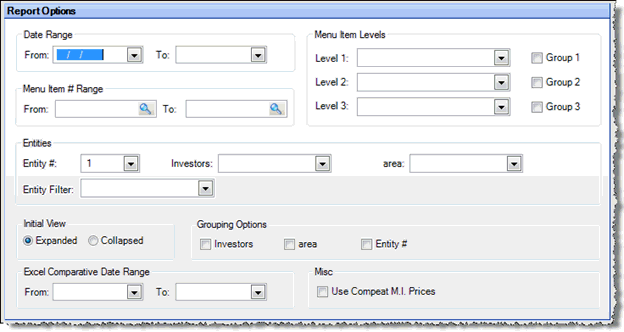
The following options are available to customize your report:
Date Range Specify a range of dates for which you wish to generate the report. These fields are required.
Note: Only menu items sold during the specified time period will be included in the report.
Menu Item Range To generate the report for a particular menu item, or for a range of menu items, enter the menu item number or range of numbers; otherwise, leave blank for all menu items.
Menu Item Levels To generate the report for a particular menu item level, enter the menu item level; otherwise, leave blank for all menu item levels. Check Group next to a level to group items in the report by that level.
Entities To limit the report to a specific entity, select the entity from the drop-down list. Alternatively, you can limit by store groups (defined under Setup > Enterprise Definitions), or by entity filter (defined under Setup > Entity > Entity Filters). Leave blank to include all locations.
Group Filter 1 Select a group, from your predefined groups, that you want to run this report for.
Group Filter 2 Select a group, from your predefined groups, that you want to run this report for.
Initial View Select whether to show the report in collapsed form (summary) or expanded form (detail). This can be changed in the report preview screen.
Grouping Options Specify whether to group the report by a store group or by entity.
Within the selected grouping, the report is sorted by Gross Profit $ (total gross profit).
The Menu Engineering report always includes the following columns of data for each menu item in the list:
Price The average menu price for the item over the time period reported. This is calculated as total sales (from POS) divided by the quantity sold for the time period reported. If an item was not purchased during the time period being reported on, Compeat will search backwards for the last time the item was purchased, and will display that price on the report; in such cases, the price is not an average.
Cost
(Theoretical cost per item) This is a representation of the menu item
cost. It is theoretical because
it is a calculated value that takes into account sales quantities
from the sales mix and recipe portions.
If an item was not purchased during the time period being reported
on, Compeat will search backwards for the last time the item was purchased,
and will display that price on the report; in this case, the price
is not an average.
Theoretical cost is always calculated using a weighted average, regardless
of the inventory valuation method selected.
Note: If an item has never been purchased (entered on an invoice or manual check), Compeat will use the Cost per Inv. defined on the Restaurant Inventory screen.
Gross Profit (Per Item) The difference between the selling price and theoretical cost (Price - Cost) for an item.
Qty The number of each menu item sold; this number comes from the imported POS data.
Qty % The percentage of the total number of items sold. This is only a percentage of those items included on the report. For example, if you are reporting only on Food items for a particular restaurant, a quantity percentage of 14.7% only indicates that this item comprises that percentage of your food item sales, not total sales which would include non-food items.
Total Sales Shows the total amount sold in dollars for the date range selected. This includes the sum of all time periods from the sales mix data.
Sales % The percentage of the total dollars sold. This is only a percentage of those items included on the report. For example, if you are reporting only on Food items for a particular restaurant, a sales percentage of 5.7% only indicates that this item comprises that percentage of your food dollars, not of the total revenue for your restaurant. This is calculated as [(total sales of the item/total sales for all items) * 100%].
Theo Cost (Total theoretical cost) Displays the total theoretical cost. This is calculated as Theo Cost x Qty Sold.
Cost % The cost percent of the item. This is calculated as [(total theoretical cost/total sales) * 100%].
CM $ (Contribution Margin) High or Low, indicating whether the gross profit per sale of the item is above (High) or below (Low) the average gross profit per sale of the report items. This is an indication of profitability.
MM % (Menu Mix) High or Low, indicating whether the menu item achieves 70% or more of average number of sales for the listed group (High), or less than 70% of the average (Low). This is an indication of popularity.
Gross Profit $ (Total) The total gross profit for the item over the specified time period. Calculated as Gross Profit (per item) x Qty.
Category Classifies each item as Star, Plowhorse, Puzzle, or Dog, depending on the combination of Contribution Margin and Menu Mix attributes of the item.
![]() Visit the Compeat Support Website
for additional information on this topic and more.
Visit the Compeat Support Website
for additional information on this topic and more.
Category |
CM $ |
MM % |
Star |
High |
High |
Plowhorse |
Low |
High |
Puzzle |
High |
Low |
Dog |
Low |
Low |
Note: The percentages on the report are only of those items included on the report; different report criteria will give you different results.
The Menu Engineering report appears similar to the following: