The Inventory Theoretical Cost report allows you to generate a listing of the theoretical cost of one or more inventory items that were sold (as part of a menu item or as part of a prep item included in a sold menu item) during the specified time period. The report is only for the entity you are currently logged into.
The cost is "theoretical" because of assumptions in sales quantities from the sales mix and variances in recipe portions. Compeat takes each inventory item and determines which menu items or prep items (recipes) it is used in. Then for each recipe, Compeat calculates a weighted average cost of each inventory item within the time period, then sums the cost of the inventory item for each of the recipes to determine an aggregate theoretical inventory item cost.
Note: If an item has never been purchased (entered on an invoice or manual check within Compeat), Compeat will use the Inv. Unit Cost defined on the Restaurant Inventory screen.
For example, if your restaurant sells four different burgers, all of which use ground beef, Compeat takes the amount of ground beef used in the four burgers and calculates an aggregate weighted average cost. Then Compeat converts the recipe units to inventory units, which are displayed on the report. For the extended cost, Compeat calculates the total number of the four hamburgers that were sold (from the POS), and multiplies that by the cost.
The report should be run for an inventory period, so Compeat can give an accurate picture of the theoretical usage (based on recipes and POS sales) and the actual usage (based on a physical inventory count). When an inventory period is specified for the date range, the variance numbers (difference between the theoretical cost and the actual cost) are most accurate.
![]() Click to view/hide picture.
Click to view/hide picture.
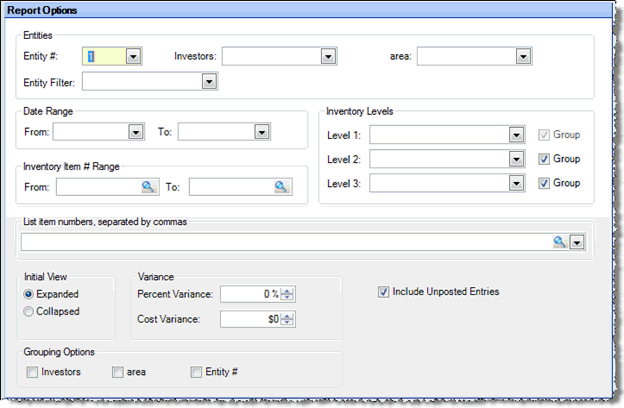
The following options are available to customize your report:
Date Range Specify a range of dates for the inventory period on which you wish to report. This field is required.
Inventory Item # Range To limit the report to a specific range of items, enter the starting and ending item numbers.
Inventory Levels To limit the report to a particular inventory level, select the inventory level from the drop-down list; otherwise, leave blank for all inventory levels. Check "Group" next to a level to group by that level and display the level description as a subheading in the report.
List item numbers To include only one or more Restaurant Inventory Items in your report, list them here (or select from the lookup box), separating each item number with a comma.
Initial View Select whether to show the report in collapsed form (summary) or expanded form (detail). This can be changed in the report preview screen.
Variance
Cost Variance Enter a dollar cost number that will restrict the report to variances (plus or minus) larger than the entered amount.
Include Unposted Entries Specify whether to include items from unposted invoices and manual checks on the report. This feature allows you to get accurate inventory variances regardless of the posting status of invoices. This allows accounting entities, who may not allow restaurants the ability to post, to get reports even before the home office has received the appropriate paperwork necessary to post the work entered by the restaurants.
Note: Only inventory items purchased during the Date Range are included in the report (you have the option to include items from unposted invoices).
Grouping Options Optionally specify a grouping criteria for the report data.
A sample Inventory Theoretical Cost report is shown below.
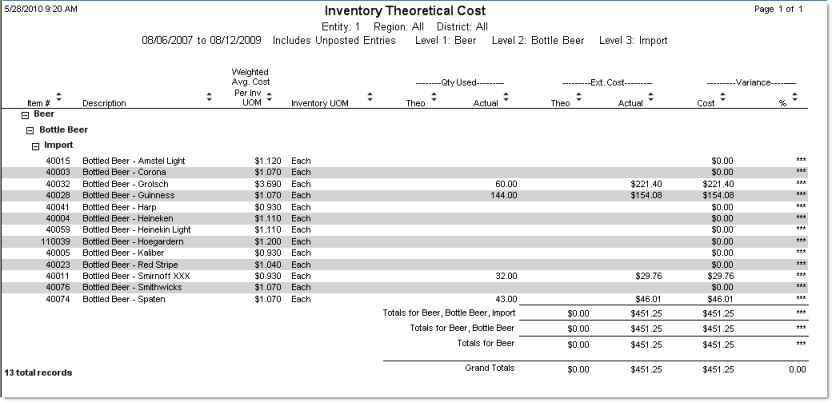
Each item is identified by its Item # and Description at the beginning of the row.
Weighted Avg. Cost Per Inv UOM Theoretical cost per unit of measure based on a weighted average calculation that takes into account different prices that may have been paid for the item. (See Weighted Average in the Other Definitions section for an in depth description of how weighted averages are calculated.)
Inventory UOM Displays the Description of the Standard Units of Measure for the item.
Qty Used, Theo Shows the theoretical quantity used. This includes the combined quantities from sales and waste (transfers out are not included).
Qty Used, Actual Shows the actual quantity used.
Note: Order counts are not used for this report. The actual quantity used is based on the last valuation count. If you compare actual quantity used from this report to the Actual Ending Inv amount on the Count Variance report, there could be significant discrepancies if order counts were used for that report.
Ext. Cost, Theo Shows the total theoretical cost for an item by multiplying the theoretical cost by the quantity used. Calculated as (Weighted Avg. Cost Per Inv UOM) x (Qty Used, Theo).
Ext. Cost, Actual Shows the total actual cost for an item by multiplying the cost by the quantity used. Calculated as (Weighted Avg. Cost Per Inv UOM) x (Qty Used, Actual).
Variance, Cost The difference in dollars between the total actual cost and the total theoretical cost. Calculated as (Ext. Cost, Actual) - (Ext. Cost, Theo).
Variance, % The percent (of total theoretical cost) difference between the total actual cost and the total theoretical cost. Calculated as [(Variance, Cost)/(Ext. Cost, Theo)] x 100%.
Note: Both the Inventory Theoretical Cost report and the
Inventory Count Variance report have columns representing theoretical
usage. In the Inventory Theoretical Cost report this is the Qty
Used, Theo column; in the Inventory Count Variance report it is
the Theo Usage column. The calculations
for each of these are slightly different between the two reports, so in
some cases the numbers may not match.
In the Inventory Theoretical Cost report, the Qty
Used, Theo amount is calculated as sales + waste quantities.
In the Inventory Count Variance report, the Theo
Usage amount is simply the sales amount. Thus, Theo
Usage = Qty Used, Theo - Waste.