The Inventory On Hand report allows you to generate a report showing the inventory transactions for a specified time period and a theoretical ending inventory. This can be useful for assessing inventory on-hand between physical counts. This report is similar to the Inventory Count Variance report, except it does not have the variance data. The report is sorted by inventory level, with the Restaurant Inventory Items and Prep Items listed alphabetically.
This report can be run for a single entity or for multiple entities by using the Entity Filter. Alternatively, you can limit by store groups (defined under Enterprise Definitions) or leave blank to include all.
Both of these options will allow you to run a report for multiple entities at once. Entity filter groups can be defined at Setup > Entities > Entity Filter. You can compare multiple entities next to one another or this data can be consolidated to give you a rolled up report for multiple entities. (This can be useful for assessing area wide data)
The theoretical ending inventory quantity is calculated by taking the actual ending inventory count from the preceding period as the beginning inventory, then adding all the purchases (from AP invoices and manual checks, or from portion cut sheets; or for prep items from the prep item creation posting), and subtracting all of the usages, the sales of the items (from the recipes in the menu items, the POS sales data, the ingredients in a prep items when creating, and the whole cuts when portioning) and any inter-store transfers of inventory or wasted and/or donated inventory (inventory adjustments, which are not broken out in this report).
Note: An asterisk is displayed on the report in the Beginning Inventory column for uncounted items— that is, items for which no count was entered. The theoretical count is used in place of an actual count when no count is available.
![]() Click to view/hide picture.
Click to view/hide picture.
Use the following options to customize your report:
Entities To limit the report to a specific entity, select the entity from the drop-down list. Alternatively, you can limit by store groups (defined under Setup > Enterprise Definitions), or by entity filter (defined under Setup > Entity > Entity Filters). Leave blank to include all locations.
Date Range The inventory period for which to calculate the inventory count. Compeat uses the day before the From date to get the beginning balance numbers from posted inventory counts. This field is required.
Inventory Item # Range To limit the report to a particular set of inventory items, enter a range of inventory item numbers.
Inventory Levels To limit the report to a particular inventory level, select the inventory level from the drop-down list; otherwise, leave blank for all inventory levels. Check "Group" next to a level to group by that level and display the level description as a subheading in the report.
List Item Numbers To include only specific items in your report, enter the item numbers or click on the finder (magnifying glass icon) and select the items you wish to include; separate multiple items with commas.
Options:
Consolidate Choose this option if you would like multiple entity data to be rolled up together for viewing as if it were one entity.
Note: In order to consolidate data you will need to run the report for multiple units using a filter group. Investors, Area, Entity Filter
Include Unposted Vouchers Specify whether to include items from unposted invoices and manual checks on the report. This feature allows you to get accurate inventory variances regardless of the posting status of invoices. This allows accounting entities, who may not allow restaurants the ability to post, to get reports even before the home office has received the appropriate paperwork necessary to post the work entered by the restaurants.
Include Costs If this box is checked, a second line will display under each inventory item that will show the dollar amounts for each quantity listed.
Note: In order to view costs on this report, your group must have "Show Costs on Inventory Count Variance Report" checked under Inventory > Inventory Counts of the Security > Groups > Screen Access tab.
Include Count Totals Check this box to include inventory category sub-totals and grand totals in line items of the report.
Include Detail If you uncheck this box, the report will not show individual inventory items, instead showing totals by inventory level definition. Check to show individual inventory item totals.
Initial View Select whether to show the report in collapsed form (summary) or expanded form (detail). This can be changed in the report preview screen.
Report Unit of Measure Choose whether you want the report displayed in inventory units or in purchase units.
Post Type:
Valuation Counts Select to use valuation counts for beginning inventory.
Order Counts - All Items Select to use order counts for beginning inventory.
Order Counts - Hot Items Only Select to use order counts for beginning inventory and limit the report to Hot Items.
The Inventory On Hand report appears similar to the following:
Note: All portioning and prep productions, both incoming and outgoing values, are reported in a single column (+/- Prod/Portioning). This means the Theo Usage column now only reflects salesmix, commissary shipments, and outside order shipments.
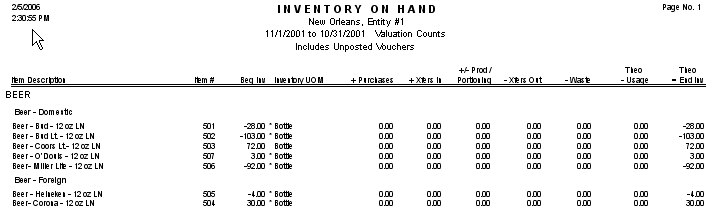
Each item is identified by its Description and/or Item # at the beginning of the row.
Note that the math used to calculate the Theoretical Ending Inventory is shown in the column headers.
Beg Inv Displays the beginning inventory on the day before the From date selected for the report, based on the post type selected (valuation or inventory counts).
UOM Displays the Description of the Standard Units of Measure for the item as either inventory or purchase units, depending on the Units of Measure selected on the report options.
Receiving Shows the quantity received (through AP Invoices or Manual Checks) during the date range specified.
Xfers In Shows the quantity of inter-store transfers received during the specified time period.
Prod/Portioning Shows the quantity produced during the specified time period.
Xfers Out Shows the quantity transferred out by inter-store transfers during the specified time period.
Waste Shows the amounted wasted during the specified time period.
Theo Usage Shows the total quantity of the item used during the date range. This includes sales, inventory transfers, waste/donations, and portioning/prep productions.
Theo End Inv Shows the theoretical ending inventory— the quantity expected based on all of the inventory-affecting transactions made in Compeat. Calculated as Beg Inv + Receiving + Xfers In + Prod/Portioning - Xfers Out - Theo Usage (when Add Across is selected in report options). Calculated as (Actual Ending Inventory dollars/Actual Ending Inventory quantity) x Theoretical Ending Inventory quantity (when "Use Actual Ending Inv $" is select in the report options).